A hospitality buyer in Dallas once slid her bid sheet across our table. Three upholstery materials, ranked by price per meter, with the cheapest PU flagged in green. Sixteen months later, the hotel lounge chairs were flaking, and that leather comparison had quietly become a full re-upholstery budget.
We procurement people have seen this movie before. The chart looks airtight on paper. Then hydrolysis, care costs, and replacement downtime rewrite the invoice. This article walks through her actual case and the four traps sitting behind most spec sheets.
The Leather Comparison That Looked Perfect on Paper
Her project covered 200 seats across a hotel lobby and two meeting lounges. The bid sheet scored each material on upfront price, color match, and the Martindale number copied from the supplier datasheet. The PU option won on every line. The numbers were not wrong. They were just incomplete.
Month one through ten, the chairs behaved. By month fourteen, the seat crowns showed micro-cracking and the bonded-leather accent chairs had split along the seams. That is textbook ester hydrolysis: moisture works into the PU film, the polymer chains break, and the coating lets go of the substrate.
She sent us two failed panels. On our bench, the PU surface layer peeled away at the fold line while the silicone sample we ran beside it showed nothing but a scuff. Same test, same day, very different invoices waiting downstream.

Contract lounge seating is where a wrong leather comparison gets expensive fastest: high cycles, humid air, no time for repairs.
Four Traps That Break Every Leather Comparison Chart
None of these traps is exotic. Each one hides in a column that procurement teams routinely leave blank.
- Price per meter, not per year. A $12 PU meter looks cheap until you replace it twice. Independent grade charts put full-grain hide at 30 MPa tensile strength and roughly 30,000 abrasion cycles, with pricing that honestly reflects the fiber structure.
- Datasheet cycles without hydrolysis context. Abrasion ratings describe a dry lab. PU in a humid lobby behaves differently, which is exactly the gap the silicone vs PU breakdown walks through.
- Care cost omitted. Hide needs conditioners every season. Silicone wipes clean with water and survives disinfectants without staining.
- Replacement downtime ignored. In contract seating, the labor to re-wrap a frame usually costs more than the fabric on the roll.
One industry analysis notes silicone leather carries roughly a 20% price premium over comparable PU per square meter. True. It also quotes a 5-10 year service claim. Also true, and that is precisely why the premium column alone is the wrong place to stop reading.
Rebuilding the Spreadsheet Around Cost per Service-Year
We rebuilt her comparison as a five-column model. Upfront cost, expected field lifespan, and then the only number that matters to a buyer: cost per service-year, labor included. The figures below come from our own quotation records and replacement reports across contract furniture upholstery programs.
| Material | Upfront ($/m²) | Field Lifespan | Cost per Service-Year | Dominant Failure |
|---|---|---|---|---|
| Top-grain hide | $25–60 | 10–15 yrs | $3.00–5.00 | Drying, patina wear |
| Bonded leather | $8–12 | Under 2 yrs | ≈ $7.50 | Surface flaking |
| PU synthetic | $5–15 | 2–5 yrs | $3.00–6.00 + labor | Hydrolysis |
| Silicone leather | $15–35 | 10+ yrs | $1.50–3.50 | None within spec |
Read vertically and the ranking flips. The “cheap” PU lands second-highest once you fold in a second re-wrap. Hide and silicone bracket the low end for different reasons: hide through fiber strength, silicone through chemistry that simply does not hydrolyze.

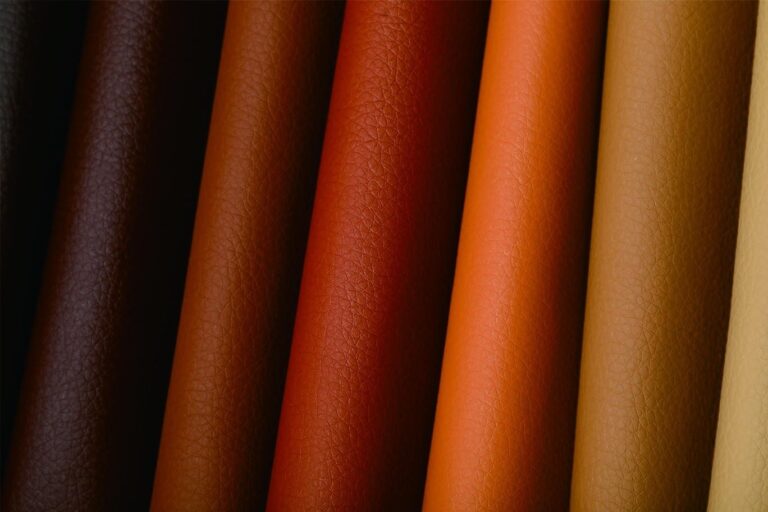
Score swatches on the same grid: price per service-year, not price per meter.
What the Bench Showed 18 Months Later
Her replacement order went to silicone leather on the seat crowns and arms, keeping the original frames. We ran the returned PU panels beside a silicone sample under ISO 12947-2. In our abrasion lab, our silicone structure holds past 200,000 cycles; the PU film showed visible surface wear at a fraction of that count.
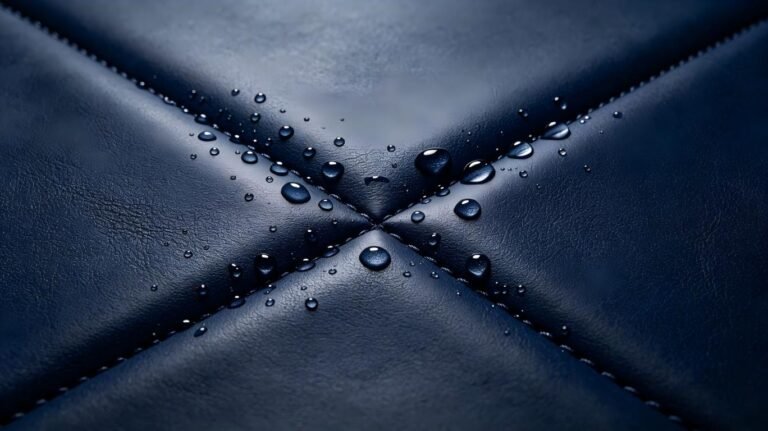
The reason is structural. Hydrolysis-resistant silicone leather uses a Si-O-Si backbone that water cannot attack, where PU relies on ester bonds that moisture slowly severs. No coating thickness can negotiate with chemistry.

Bending and abrasion benches: where a leather comparison stops being a spreadsheet exercise.
Watch the side-by-side bench test: silicone vs PU wear after the same cycle count. The gap is the argument.
18-month re-inspection: zero coating separation on the silicone chairs. The PU chairs kept as a control had failed on 31 of 44 seats in the same lobby.
The Only Leather Comparison Worth Doing
A leather comparison should answer one question: what does this material cost me per year in service, not per meter in a quote. Rank your shortlist that way and the chart picks the winner for you.
About TOPSUN
TOPSUN manufactures organic silicone leather for contract seating, hospitality lounges, and high-cycle furniture programs where re-upholstery budgets are not part of the plan.
Our three production bases deliver 6 million meters a year with verified 200,000-cycle Martindale performance, non-detect VOC emissions, and OEM color and texture matching for furniture buyers.
References
1. https://szoneierleather.com/custom-leather-fabr… — full-grain tensile strength (30 MPa), abrasion cycles, and grade hierarchy cited in the traps section
2. https://wandaoleather.com/blog/what-is-silicone… — ~20% silicone-over-PU price premium and 5–10 year service-life commentary
3. https://straitsresearch.com/report/synthetic-le… — synthetic leather market valued at USD 46.74B in 2025, growing at 7.54% CAGR to 2034