Consumer textiles are judged by feel. Industry fabrics are judged by what happens after three years of abuse. That gap in purchasing logic is wider than most newcomers expect. The conclusion comes first: each industrial sector runs its own performance gate. The gate decides the price, the test plan, and the supplier list. This article breaks the market into four sectors. Each sector gets its own tests and its own cost of failure. Match your sourcing questions to the sector you actually sell into, and the evaluation gets simpler at every step.
| Sector | Performance Gate | Signature Tests | Cost of Failure |
|---|---|---|---|
| Automotive & transport | Flame, fogging, abrasion | FMVSS 302, Martindale | Mid-program material swap |
| Medical & healthcare | Barrier plus biocompatibility | ISO 10993, disinfection cycles | Hygiene compliance loss |
| Outdoor & geotextile | UV and hydrolysis endurance | UV 1,500 h, salt spray 1,000 h | Field failure in 2-3 seasons |
| Protective apparel | Certified flame response | EN 13773, vertical burn | Failed audit and liability |
Reading the table is straightforward once you know your sector. Find the row you sell into, then borrow its first question for your next RFQ. The sections below expand each gate with the numbers behind it. Every figure comes from published market research or from tests run in our own laboratory. Where the two disagree, the stricter number wins.
Automotive Leads Industry Fabrics Demand at 31.8%
Automotive took a 31.8% revenue share of the industrial fabric market in 2025. The mobility segment behind it generated roughly USD 50 billion in technical textiles that year. That figure is on its way to USD 76.2 billion by 2035. Seat upholstery, headliners, airbag fabric, and trunk trim share one procurement logic. Flammability comes first, abrasion second, emissions third.
Electrification is tightening the gate, not loosening it. EV programs push for lighter components, lower fogging, and thermal stability near battery zones. That combination favors suppliers who document all three. Industrial fabrics for automotive interiors therefore carry the most complete test dossiers of any sector. Cabin odor and fogging limits are now written into most Tier-1 sourcing packs.
The numbers behind a serious automotive dossier are specific. FMVSS 302 burn-rate compliance is the entry ticket for interior trim. Martindale abrasion at 200,000+ cycles (ISO 12947) covers high-touch seating surfaces. Tensile strength above 15 N/mm and tear resistance above 20 N keep cushions intact under daily load. Fogging and odor results complete the file.
Thermal tolerance runs from -40°C up to 200°C on our Classic and Designer lines. That window matters near battery housings and sun-exposed dashboards. Hydrolysis is the quieter failure mode. PU surfaces typically degrade within three to five years of humid service. Silicone chemistry does not hydrolyze, which is why our chamber test runs fourteen weeks with no delamination.
A Tier-1 trim maker we support moved a cushion program to silicone-coated fabric after hydrolysis complaints from a coastal market. Warranty claims had been arriving at three per month, all with the same sticky-surface symptom. The switch ended the warranty stream and kept the same tooling. Program timing slipped by one validation cycle, not one season.
Sector specifics are catalogued in our automotive interiors application page.

Transport seating shares the automotive gate: flame, wear, emissions.
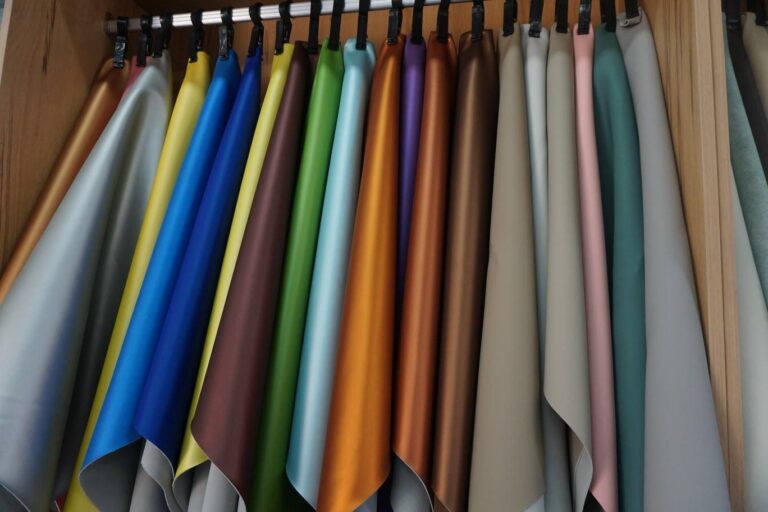
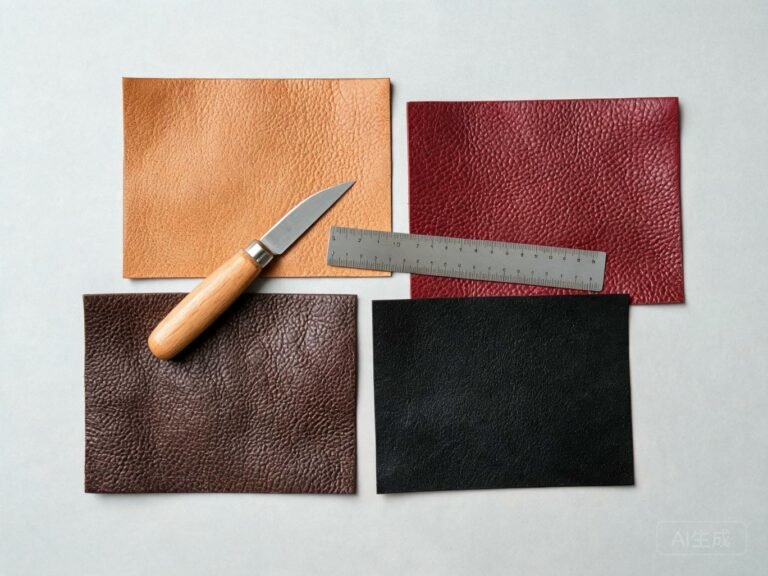
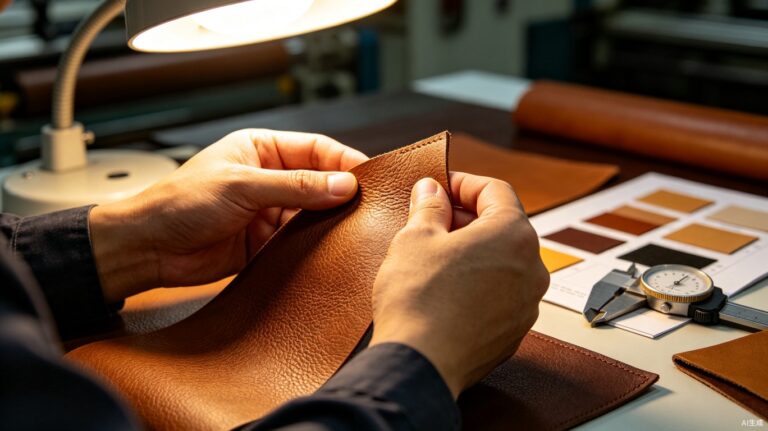
The property set that repeats across every industrial sector.
Medical Textiles Sell Barrier Performance
Among technical textile categories, MedTech stands apart because the material touches skin and, sometimes, open tissue. Barrier performance comes first. Biocompatibility files under ISO 10993 come second, and tolerance of hospital-grade disinfection comes a close third.
A mattress cover or treatment chair upholstery faces daily alcohol wipes. If it cannot survive that routine, it fails long before the abrasion report says it should. We built our medical line around that reality. Surfaces are alcohol-safe and rated Level 5 for stain resistance. VOC results come back non-detect under ISO 16000-6. Biocompatibility files ship with every order, and FDA 21 CFR clearance covers adjacent food-contact uses.
The application list keeps growing. Exam chairs and imaging table pads need stable, wipeable surfaces. Dental headrests and blood-draw cushions add direct patient skin contact to the requirement. Senior living furniture layers homelike color palettes on top of hygiene demands. Hospital procurement audits now check surface files as routinely as they check prices. Each of those variants is a specification question first.
Examples by product family live on our medical healthcare page.

In healthcare, disinfection tolerance outranks almost every other spec.
Outdoor and Geotextile Work Punishes Weak UV and Hydrolysis Data
Construction and geotextiles are the fastest-growing end use of industrial fabric, and they are also the least forgiving outdoors. A coated textile on a marina bench faces ultraviolet exposure, salt atmosphere, and standing humidity at once. A rooftop installation faces the same trio. Three numbers separate survivors from casualties. First, UV stability beyond 1,500 hours without fading. Second, salt-spray endurance past 1,000 hours under ASTM B117. Third, zero delamination after fourteen weeks in an 85°C, 85% relative humidity chamber.
Buyers who skip those questions usually discover the answers in the field, two or three seasons in. The surface chalks, the lamination separates, or the color drifts beyond brand tolerance. Weather does not negotiate, and neither do replacement logistics at remote sites. Coating choice decides which side of that bill you end up on.
Material geometry matters in outdoor work too. Our coated fabric runs from 0.23 mm to 3.0 mm in thickness across collections. Width holds at 1,350-1,400 mm, which covers standard awning and seating die-cut layouts. Salt-spray endurance of that order is standard on our marine grade. For program buyers, the minimum order sits at 500 meters with 7-15 day delivery. That lot size suits pilot programs before fleet-wide rollout.
Cleaning and color control deserve equal attention outdoors. Marina furniture gets washed with whatever is at hand, often strong deck soap. Our surfaces tolerate that routine and hold color fastness at grade 4-5. Delta E spectrophotometer checks keep production batches inside brand tolerance. A fabric that fades unevenly under real sunlight reads as old long before it fails structurally.
None of this makes weather-grade fabric cheap. It makes cheap weather-grade fabric expensive. Replacement logistics at remote sites often exceed the original material cost by a wide margin. Cranes, access permits, and downtime dominate the bill. Asking for UV and hydrolysis data first is the cheapest risk control available in this sector. Ask for the chamber report, not a summary of it.
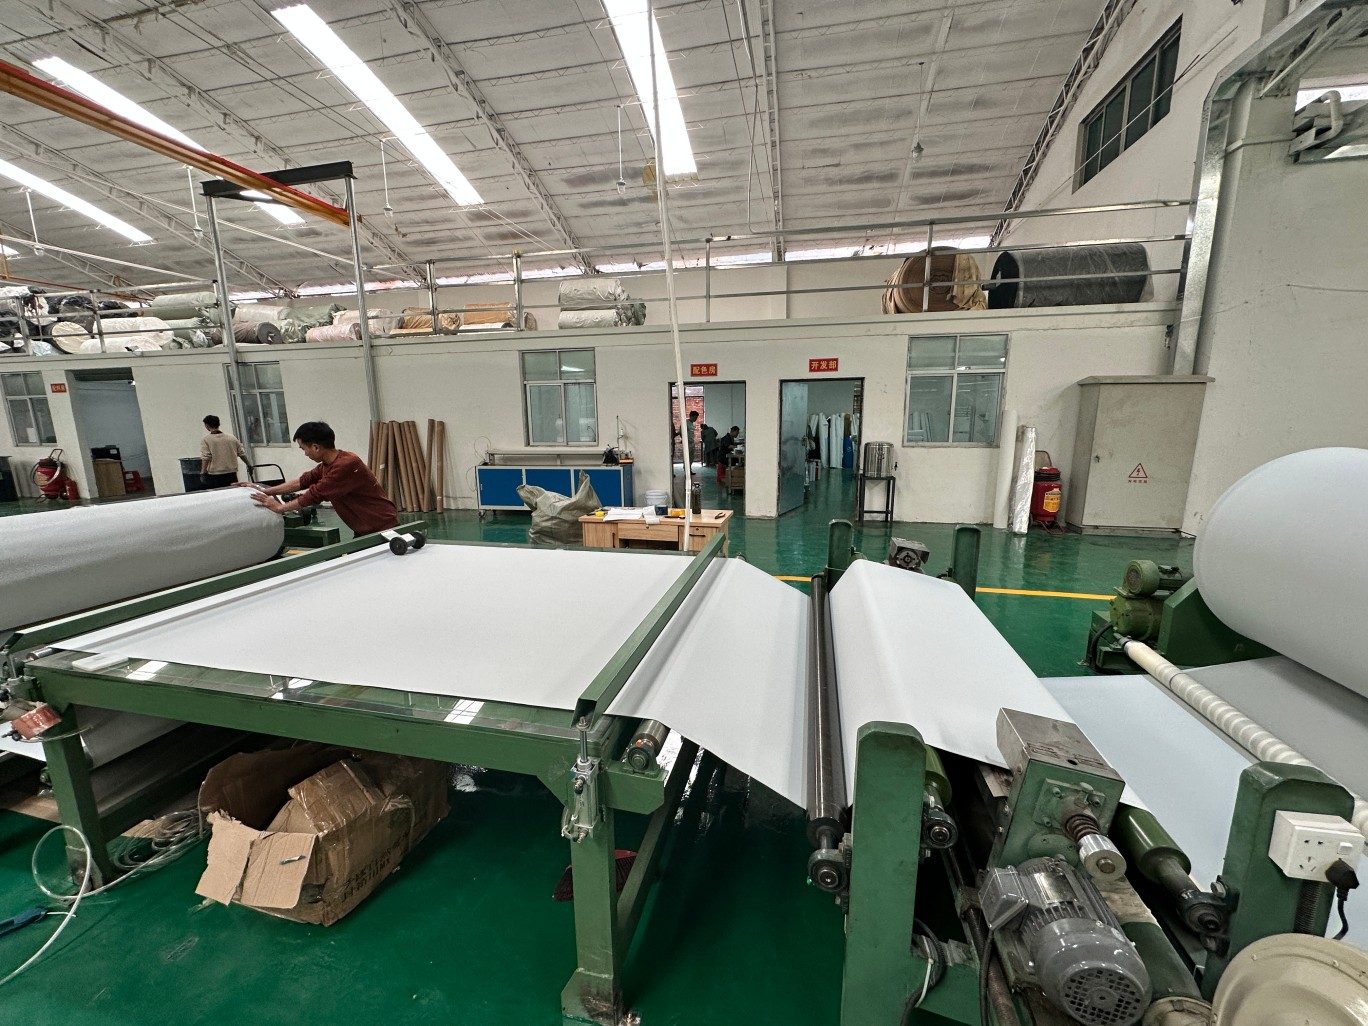
Weather-grade fabric starts with tension-controlled base material.
Protective Apparel: Where the Certificate Is the Product
Protective clothing and workplace safety textiles invert the usual buying logic. The fabric itself matters, but what the buyer actually purchases is documented flame response. EN 13773 Class 4 is the highest classification for contract and industrial textiles. It is the number that opens doors in this sector.
Two habits separate professional buyers here. They verify that the certificate names the production batch, not just the brochure. And they expect the flame resistance to be inherent in the polymer. Additive treatments fade with washing and time.
Our Super Flame Retardant line builds the property into the silicone layer itself. Third-party inspection is welcome on every order, whether SGS, BV, or TÜV. As a coated industrial fabric supplier working across these sectors, we see the same pattern every time. The sectors with the highest certification stakes show the least tolerance for vague documentation. Sector comparisons by application are collected on our industry applications overview.

Certificates should trace to the batch, not the brochure.
Choosing Industry Fabrics by Sector: A Decision Tree
The supply side explains why gate logic matters. The industrial fabric market is fragmented at the top. Reports and Data puts the largest single supplier near a 2.5% revenue share in 2025. The top five combined hold roughly 8.1%. No single vendor controls the specification. A documented supplier can be replaced by another documented supplier without redesign. Fragmentation also means switching costs are lower than buyers assume. Nothing about a sector gate changes with the vendor name on the box.
For buyers, fragmentation cuts both ways. Pricing leverage is real when five qualified suppliers chase the same program. But inconsistent quality between batches is just as real. Both effects show up in the same negotiation, usually in the same week. The screening questions below compress our own quotation experience across the four sectors above.
Match your first question to the gate before you shortlist suppliers:
- If your program is automotive seating, start with flammability and Martindale data, then check hydrolysis history.
- If you buy for healthcare, lead with biocompatibility files and disinfection tolerance.
- If the fabric faces weather, ask for UV hours and salt-spray endurance before you ask for price.
- If certification drives the sale, verify the certificate covers the production batch, not the brochure.
A quote that survives the gate is worth more than a cheaper quote that cannot. Replacement, retesting, and reputation costs dwarf the unit price gap. That is how experienced buyers of industry fabrics separate strong suppliers from smooth ones within a week.
Request Sample Dossiers with Test Reports
References
1. https://www.reportsanddata.com/report-detail/in… – Industrial fabric market at USD 165.0B in 2025 rising to USD 340.0B by 2035; woven held 44.7% share, automotive 31.8%, top supplier near 2.5%, top five combined 8.1% (2025)
2. https://www.gminsights.com/industry-analysis/te… – Technical textiles market of USD 227.0B in 2025 toward USD 382.8B by 2035; MobilTech segment USD 50.0B to USD 76.2B (2026)